Notes
-
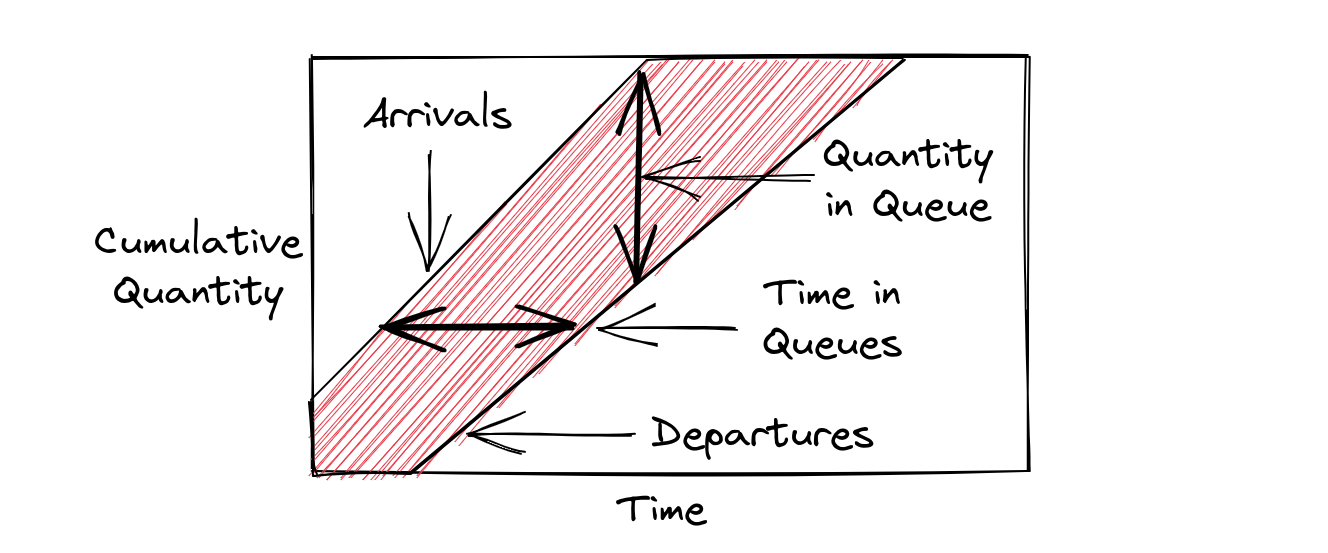
The cumulative flow diagram (CFD) is a helpful tool for managing queues.
-
The diagram uses:
- Time as its horizontal axis;
- Cumulative quantity as its vertical axis;
- Cumulative arrivals at a process as one variable;
- Cumulative departure as a second variable.
-
The vertical distance between the arrival line and the departure line is work that has arrived but not yet departed, the size of the queue at a time.
-
The horizontal distance between the lines tells the cycle time through the process for an item of work.
-
The total area between these two lines tells the size of the queue.
-
The slope of the arrival line tells the arrival rate of the queue.
-
The slope of the departure line tells the capacity of the process of emptying the queue.

Cumulative Flow Diagram (CFD)